Processing
Calculations
This module contains functions used by other processing modules.
- pewlib.process.calc.local_maxima(x)
Indicies of local maxima.
Maxima are values greater than the 2 values surrounding them.
- Parameters:
x (
ndarray) – 1d array- Return type:
ndarray- Returns:
indicies of maxima
- pewlib.process.calc.normalise(x, vmin=0.0, vmax=1.0)
Normalise an array.
- Parameters:
x (
ndarray) – arrayvmin (
float) – new minimumvmax (
float) – new maxmimum
- Raises:
ValueError if x is a simgle value –
- Return type:
ndarray
- pewlib.process.calc.reset_cumsum(x, reset_value=0.0)
Cumulative sum that resets at the given value.
- Parameters:
x (
ndarray) – arrayreset_value (
float) – Value where the cumsum resets to 0
- Return type:
ndarray
- pewlib.process.calc.shuffle_blocks(x, block, mask=None, mode='pad', shuffle_partial=False)
Shuffle an ndim array as tiles of a certain size.
If a mask is passed then only the region within the mask is shuffled. If shuffle_partial then partially masked blocks will be shuffled otherwise only fully masked blocks are. The inplace mode is much faster but cannot shuffle array edges.
- Parameters:
x (
ndarray) – arrayblock (
tuple[int,...]) – block shape, same dims as xmask (
ndarray|None) – mask, same shape as x, optionalmode (
str) – method, {‘pad’, ‘inplace’}shuffle_partial (
bool) – shuffle partially masked blocks
- Return type:
ndarray- Returns:
new array if pad, view if inplace
- pewlib.process.calc.subpixel_offset(x, offsets, pixelsize)
Offsets layers in a 3d array.
First x is enlarged by pixelsize then list of offsets are applied across axis 2 of x. If the first offset is not (0, 0) then it is prepended. Given offsets of [(0, 0), (1, 1)] and pixelsize of (2, 2) each layer will be streched by 2 and every 2nd layer will be shifted by 1 pixel.
- Parameters:
offsets (
list[tuple[int,int]]) – pixel offsets in (x, y)pixelsize (
tuple[int,int]) – enlargement (x, y)
- Return type:
ndarray- Returns:
array
- pewlib.process.calc.subpixel_offset_equal(x, offsets, pixelsize)
Offsets layers in a 3d array.
Special case of ‘subpixel_offset’ where x==y for offsets and pixelsize.
- Parameters:
offsets (
list[int]) – pixel offsets in (x, y)pixelsize (
int) – enlargement (x, y)
- Return type:
ndarray- Returns:
array
- pewlib.process.calc.view_as_blocks(x, block, step=None)
Block view of array
Can be overlapping if step < block.
- Parameters:
x (
ndarray) – arrayblock (
tuple[int,...]) – block size, same dims as xstep (
tuple[int,...] |None) – step, same dims as x, defaults to block
- Return type:
ndarray- Returns:
view into array
See also
skimage.util.shape.view_as_blocks()
Colocalisation
Colcalisation can be used to quantify the spacial relationship between elements. A few ofthe many available algorithms are implemented in this file.
- pewlib.process.colocal.costes(x, y, n_scrambles=200)
Performs Costes colocalisation.
The threshold at which no colocalisation appears (R < 0) is first calculated and then used to find Manders M1 and M2.
- Parameters:
x (
ndarray) – arrayy (
ndarray) – array, same shape as xn_scrambles (
int) – scrambles for Pearson probability
- Return type:
tuple[float,float,float,float]- Returns:
Pearson’s R probability of Pearson’s R Mander’s M1 Mander’s M2
See also
pewlib.process.colocal.costes_threshold()pewlib.process.colocal.manders()pewlib.process.colocal.pearsonr_probablity()References
- Costes, S. V.; Daelemans, D.; Cho, E. H.; Dobbin, Z.; Pavlakis, G.
& Lockett, S. Automatic and Quantitative Measurement of Protein-Protein Colocalization in Live Cells Biophysical Journal, Elsevier BV, 2004, 86, 3993-4003
- pewlib.process.colocal.costes_threshold(x, y, target_r=0.0)
Calculates Costes thresholds.
Pearson’s R is calculated for values of x and y that are above an increasing threshold. Once the calculated R value is above target_r the thresholds are returned. The threshold for y equals ‘tx’ * ‘a’ + ‘b’.
- Parameters:
x (
ndarray) – arrayy (
ndarray) – array, same shape as xtarget_r (
float) – value of R at which stop incrementing
- Return type:
tuple[float,float,float]- Returns:
threshold for x, tx slope, a intercept, b
See also
References
- Costes, S. V.; Daelemans, D.; Cho, E. H.; Dobbin, Z.; Pavlakis, G.
& Lockett, S. Automatic and Quantitative Measurement of Protein-Protein Colocalization in Live Cells Biophysical Journal, Elsevier BV, 2004, 86, 3993-4003
- pewlib.process.colocal.li_icq(x, y)
Calculates Li’s ICQ.
The intenisty correlation quotient calculates the number of pixels where both x and y are above or below their means. A value of 0 indicates no correlation, below 0 segregation and above 0 colocalisation.
- Parameters:
x (
ndarray) – arrayy (
ndarray) – array, same shape as x
- Return type:
float- Returns:
value between -0.5 and 0.5
References
- Li, Q. A Syntaxin 1, G o, and N-Type Calcium Channel Complex at
a Presynaptic Nerve Terminal: Analysis by Quantitative Immunocolocalization Journal of Neuroscience, Society for Neuroscience, 2004, 24, 4070-4081
- pewlib.process.colocal.manders(x, y, tx=None, ty=None)
Manders’ correlation coefficients.
- Parameters:
x (
ndarray) – arrayy (
ndarray) – array, same shape as xtx (
float|None) – threshold for x, defaults to x.min()ty (
float|None) – threshold for y, defaults to y.min()
- Return type:
tuple[float,float]- Returns:
M1, factional overlap of x to y M2, factional overlap of y to x
References
- MANDERS, E. M. M.; VERBEEK, F. J. & J. A., ATEN
Measurement of co-localization of objects in dual-colour confocal images Journal of Microscopy, Wiley, 1993, 169, 375-382
- pewlib.process.colocal.pearsonr(x, y)
Pearson’s colocalisation coefficient.
A value of 0 indicates no correlation, below 0 segregation and above 0 colocalisation.
- Parameters:
x (
ndarray) – arrayy (
ndarray) – array, same shape as x
- Return type:
float- Returns:
value between -1 and 1
- pewlib.process.colocal.pearsonr_probablity(x, y, block=3, mask=None, shuffle_partial=False, n=500)
Evalulates Probability of Pearson’s coefficient.
Calculates Pearson’s R of x and y then shuffles y n times, retesting Pearson’s R. The probability is defined as the ratio of R’s produced by the shuffling that are lower than the original R. Args block, mask and shuffle_partial are passed to ‘shuffle_blocks’. Implemented as per Costes [1].
- Parameters:
x (
ndarray) – arrayy (
ndarray) – array, same shape as xblock (
int) – block size for shufflemask (
ndarray|None) – mask for shuffleshuffle_partial (
bool) – shuffle partially masked blocksn (
int) – number of shuffles to perform
- Return type:
tuple[float,float]- Returns:
Pearsons’s r probability, p, of the r
References
Convolution
Conv- and deconvolution have many applications in image processing such as adding or removing blur. This module contains functions for performing 1-dimensional convolutions as well as functions for creating various distributions.
- pewlib.process.convolve.beta(size, alpha, beta, scale=1.0, shift=0.0)
Beta distribution.
Range of 0 to 1. The scale and shift arguments can be used to change the range.
- Parameters:
size (
int) – size of distributionalpha (
float) – alpha term, > 0beta (
float) – beta term, > 0scale (
float) – scale xshift (
float) – shift x
- Return type:
ndarray- Returns:
array of (x, y) points
- pewlib.process.convolve.convolve(x, psf, mode='pad')
Convolve with ‘pad’ mode.
If mode is ‘pad’ then x is edge padded to converse size on convolution. Other modes are passed directly to
numpy.convolve().- Parameters:
x (
ndarray) – arraypsf (
ndarray) – point spread functionmode (
str) – convolution mode {‘pad’, ‘full’, ‘valid’, ‘same’}
See also
numpy.convolve()- Return type:
ndarray
- pewlib.process.convolve.deconvolve(x, psf, mode='valid')
Inverse of convolution.
Deconvolution is performed in frequency domain.
- Parameters:
x (
ndarray) – arraypsf (
ndarray) – point spread functionmode (
str) – if same, return same size as x {‘valid’, ‘same’}
Notes
- pewlib.process.convolve.erf(x)
Error function approximation.
The maximum error is 1.5e-7 [1].
- Parameters:
x (
float|ndarray) – value- Return type:
float|ndarray- Returns:
approximation of error function
References
- pewlib.process.convolve.erfinv(x)
Inverse error function approximation.
The maximum error is 6e-3 [2].
- Parameters:
x (
float) – value- Return type:
float- Returns:
approximation of inverse error function
References
- pewlib.process.convolve.exponential(size, _lambda, scale=1.0, shift=1e-06)
Exponential distribution.
Range of 0 to size, the scale and shift arguments can be used to change the range.
- Parameters:
size (
int) – size of distribution_lambda (
float) – lambda term, > 0scale (
float) – scale xshift (
float) – shift x
- Return type:
ndarray- Returns:
array of (x, y) points
- pewlib.process.convolve.gamma(x)
Gamma function approximation.
Maximum error of 3e-7 [3].
- Parameters:
x (
float) – value- Return type:
float- Returns:
approximation of error function
References:
- pewlib.process.convolve.inversegamma(size, alpha, beta, scale=1.0, shift=1e-06)
Inverse Gamma distribution.
Range of 0 to size, the scale and shift arguments can be used to change the range.
- Parameters:
size (
int) – size of distributionalpha (
float) – alpha term, > 0beta (
float) – beta term, > 0scale (
float) – scale xshift (
float) – shift x
- Return type:
ndarray- Returns:
array of (x, y) points
- pewlib.process.convolve.laplace(size, b, mu, scale=1.0, shift=0.0)
Laplace distribution.
Range of -0.5 * size to 0.5 * size, the scale and shift arguments can be used to change the range.
- Parameters:
size (
int) – size of distributionb (
float) – scale term, > 0mu (
float) – locationscale (
float) – scale xshift (
float) – shift x
- Return type:
ndarray- Returns:
array of (x, y) points
- pewlib.process.convolve.loglaplace(size, b, mu, scale=1.0, shift=1e-06)
Log-Laplace distribution.
Range of 0 to size, the scale and shift arguments can be used to change the range.
- Parameters:
size (
int) – size of distributionb (
float) – scale term, > 0mu (
float) – locationscale (
float) – scale xshift (
float) – shift x
- Return type:
ndarray- Returns:
array of (x, y) points
- pewlib.process.convolve.lognormal(size, sigma, mu, scale=1.0, shift=1e-06)
Log-normal distribution.
Range of 0 to size, the scale and shift arguments can be used to change the range.
- Parameters:
size (
int) – size of distributionsigma (
float) – sigma term, > 0mu (
float) – locationscale (
float) – scale xshift (
float) – shift x
- Return type:
ndarray- Returns:
array of (x, y) points
- pewlib.process.convolve.normal(size, sigma, mu, scale=1.0, shift=0.0)
Normal distribution.
Range of -0.5 * size to 0.5 * size, the scale and shift arguments can be used to change the range.
- Parameters:
size (
int) – size of distributionsigma (
float) – sqrt variance, > 0mu (
float) – meanscale (
float) – scale xshift (
float) – shift x
- Return type:
ndarray- Returns:
array of (x, y) points
- pewlib.process.convolve.super_gaussian(size, sigma, mu, power, scale=1.0, shift=0.0)
Super-Gaussian distribution.
Range of -0.5 * size to 0.5 * size, the scale and shift arguments can be used to change the range.
- Parameters:
size (
int) – size of distributionsigma (
float) – sqrt variance, > 0mu (
float) – meanpower (
float) – exponentscale (
float) – scale xshift (
float) – shift x
- Return type:
ndarray- Returns:
array of (x, y) points
- pewlib.process.convolve.triangular(size, a, b, scale=1.0, shift=0.0)
Triangular distribution.
Range of -0.5 * size to 0.5 * size, the scale and shift arguments can be used to change the range.
- Parameters:
size (
int) – size of distributiona (
float) – a <= x <= bb (
float) – a < bc – a <= c <= b
scale (
float) – scale xshift (
float) – shift x
- Return type:
ndarray- Returns:
array of (x, y) points
Filtering
Filtering can be used to remove artifacts, such as spikes, from images. Care must be taken when using filtering to ensure that legitmate data is not also altered.
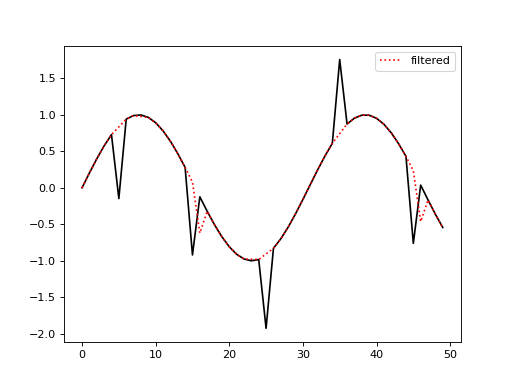
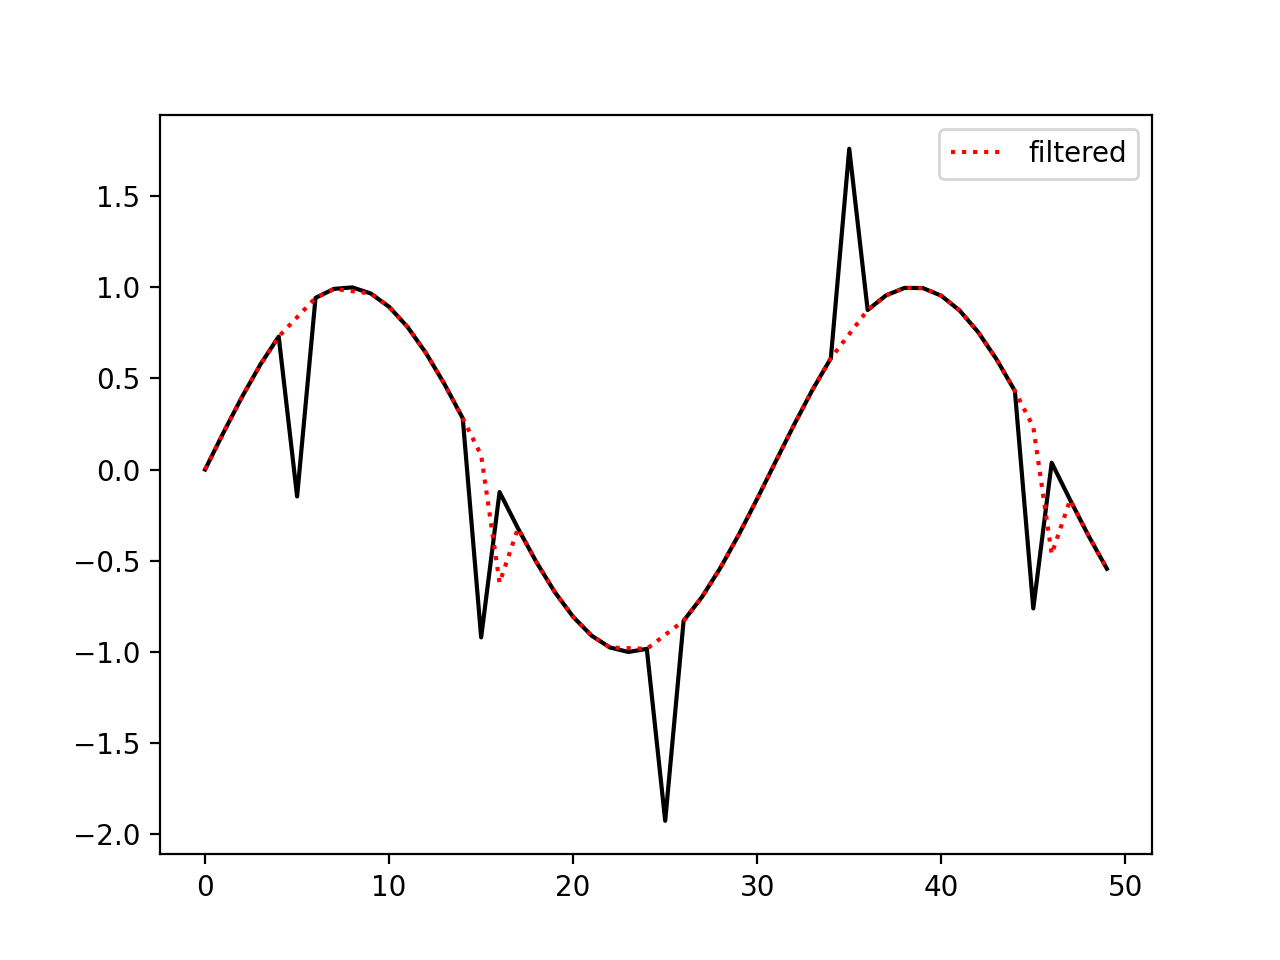
- pewlib.process.filters.rolling_mean(x, block, threshold=3.0)
Filter an array using rolling mean.
Each value of x is compared to the mean of its block, the values arround it. If it is threshold times the standard deviation with the central value then it is considered an outlier. Outliers are set to the local mean without the central value.
- Parameters:
x (
ndarray) – arrayblock (
int|tuple[int,...]) – size of window, int or same dims as xthreshold (
float) – number of stddevs away from mean to consider outlier
- Return type:
ndarray- Returns:
array with outliers set to local means
Example
Removing spikes from 1d data.
>>> import numpy as np
>>> from pewlib.process import filters
>>> a = np.sin(np.linspace(0, 1, 50))
>>> a[5::10] +=np.random.choice([-1, 1], size=10)
>>> b = filters.rolling_mean(a, 3, threshold=1.0)
(
Source code,png,hires.png,pdf)
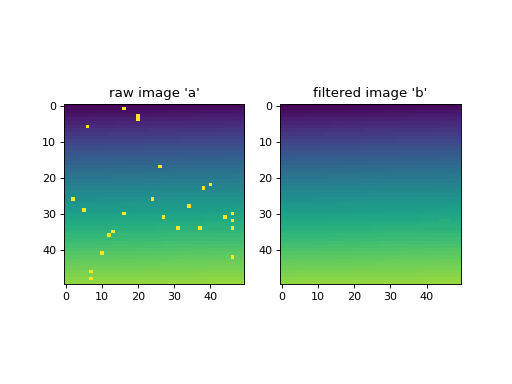
- pewlib.process.filters.rolling_median(x, block, threshold=3.0)
Filter an array using rolling median.
Each value of x is compared to the median of its block, the values arround it. If it is threshold times the stdev from the median then it is considered an outlier. Outliers are set to the local median.
- Parameters:
x (
ndarray) – arrayblock (
int|tuple[int,...]) – size of window, int or same dims as xthreshold (
float) – number of SDs (via MAD) away from median to consider outlier
- Return type:
ndarray- Returns:
array with outliers set to local means
Example
Removing poisson noise from an image.
>>> import numpy as np
>>> from pewlib.process import filters
>>> a = np.sin(np.linspace(0, 1, 2500).reshape((50, 50)))
>>> a += np.random.poisson(lam=0.01, size=(50, 50))
>>> b = filters.rolling_median(a, (5, 5), threshold=3.0)
(
Source code,png,hires.png,pdf)
Peakfinding
This module is under devolopment.
Thresholding
- pewlib.process.threshold.otsu(x, remove_nan=True)
Calculates the otsu threshold.
The Otsu threshold minimises intra-class variance for a two class system. If remove_nan then all nans are removed before computation.
- Parameters:
x (
ndarray) – arrayremove_nan (
bool) – remove nan values
See also
skimage.filters.threshold_otsu()- Return type:
float